
Salary Statistics in the US
Please find the salary statistics in the US, these estimated salary ranges for popular tech, engineering, business, and finance roles in the United States and remote job market. The data is based on recent job listings, employer disclosures, and market trends for 2025–2026. Salaries may vary depending on experience, company size, and job location.
Tech & IT Salary Statistics (2025–2026)
| Job Title | Min Salary (USD) | Max Salary (USD) | Median Salary (USD) | Experience |
|---|---|---|---|---|
| Software Engineer | $95,000 | $145,000 | $120,000 | 2–5 years |
| Senior Software Engineer | $120,000 | $175,000 | $150,000 | 5–8 years |
| Frontend Developer | $85,000 | $130,000 | $110,000 | 2–5 years |
| Backend Developer | $90,000 | $140,000 | $115,000 | 2–5 years |
| Full Stack Developer | $95,000 | $150,000 | $125,000 | 3–6 years |
| DevOps Engineer | $110,000 | $160,000 | $135,000 | 3–7 years |
| Cloud Engineer | $115,000 | $165,000 | $140,000 | 3–7 years |
| Data Scientist | $105,000 | $155,000 | $130,000 | 3–6 years |
| Cybersecurity Analyst | $95,000 | $140,000 | $115,000 | 2–5 years |
| Product Manager (Tech) | $115,000 | $170,000 | $145,000 | 4–8 years |
Engineering & DevOps Roles (2025–2026)
| Job Title | Min Salary (USD) | Max Salary (USD) | Median Salary (USD) | Experience |
|---|---|---|---|---|
| DevOps Engineer | $110,000 | $165,000 | $140,000 | 3–7 years |
| Site Reliability Engineer (SRE) | $120,000 | $175,000 | $150,000 | 4–8 years |
| Cloud Solutions Architect | $130,000 | $190,000 | $160,000 | 6–10 years |
| Systems Engineer | $95,000 | $140,000 | $115,000 | 3–6 years |
| Network Engineer | $85,000 | $130,000 | $105,000 | 3–6 years |
| Platform Engineer | $115,000 | $170,000 | $145,000 | 4–8 years |
| Infrastructure Engineer | $100,000 | $150,000 | $125,000 | 3–7 years |
| Security Engineer | $115,000 | $170,000 | $145,000 | 4–8 years |
| Automation Engineer | $95,000 | $145,000 | $120,000 | 3–6 years |
| Release Engineer | $90,000 | $135,000 | $110,000 | 3–5 years |
Business, Management & Operations (2025–2026)
| Job Title | Min Salary (USD) | Max Salary (USD) | Median Salary (USD) | Experience |
|---|---|---|---|---|
| Product Manager | $115,000 | $170,000 | $145,000 | 4–8 years |
| Technical Program Manager | $120,000 | $180,000 | $155,000 | 5–9 years |
| Operations Manager | $85,000 | $130,000 | $105,000 | 4–8 years |
| Business Analyst | $75,000 | $115,000 | $95,000 | 2–5 years |
| Project Manager | $90,000 | $140,000 | $115,000 | 4–8 years |
| Scrum Master | $95,000 | $135,000 | $110,000 | 3–6 years |
| IT Manager | $110,000 | $165,000 | $140,000 | 6–10 years |
| Engineering Manager | $130,000 | $190,000 | $160,000 | 7–12 years |
| Customer Success Manager | $80,000 | $125,000 | $100,000 | 3–6 years |
| Business Operations Manager | $95,000 | $145,000 | $120,000 | 5–9 years |
Finance & Data Roles (2025–2026)
| Job Title | Min Salary (USD) | Max Salary (USD) | Median Salary (USD) | Experience |
|---|---|---|---|---|
| Data Analyst | $75,000 | $115,000 | $95,000 | 2–5 years |
| Senior Data Analyst | $95,000 | $140,000 | $120,000 | 4–7 years |
| Data Scientist | $105,000 | $160,000 | $135,000 | 3–6 years |
| Machine Learning Engineer | $115,000 | $175,000 | $150,000 | 4–8 years |
| BI Developer | $85,000 | $130,000 | $110,000 | 3–6 years |
| Financial Analyst | $70,000 | $110,000 | $90,000 | 2–5 years |
| Senior Financial Analyst | $90,000 | $135,000 | $115,000 | 4–7 years |
| Revenue Operations Analyst | $80,000 | $125,000 | $100,000 | 3–6 years |
| Data Engineer | $110,000 | $165,000 | $140,000 | 4–8 years |
| Quantitative Analyst | $120,000 | $185,000 | $155,000 | 5–9 years |
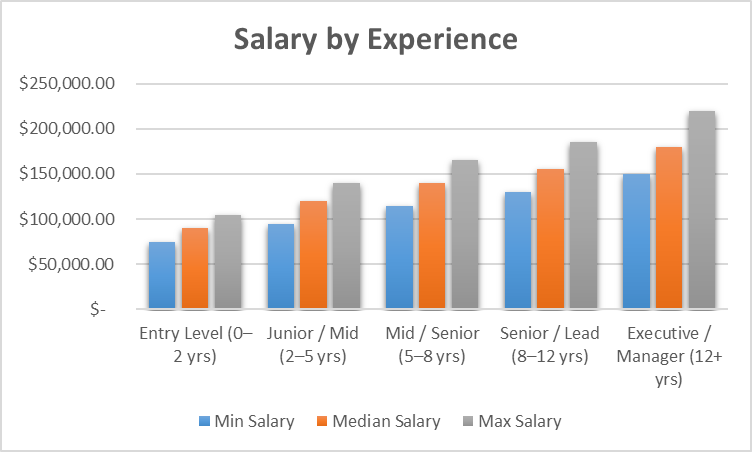
Salary by Experience (2025–2026)
| Experience Level | Average Min Salary (USD) | Average Max Salary (USD) | Average Median Salary (USD) |
|---|---|---|---|
| Entry Level (0–2 yrs) | $75,000 | $105,000 | $90,000 |
| Junior / Mid Level (2–5 yrs) | $95,000 | $140,000 | $120,000 |
| Mid / Senior Level (5–8 yrs) | $115,000 | $165,000 | $140,000 |
| Senior / Lead Level (8–12 yrs) | $130,000 | $185,000 | $155,000 |
| Executive / Manager (12+ yrs) | $150,000 | $220,000 | $180,000 |
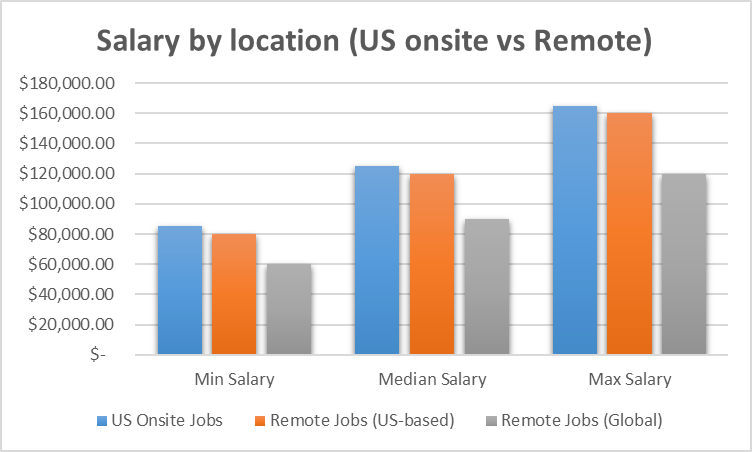
Salary by Location (US Onsite vs Remote, 2025–2026)
| Job Type / Location | Average Min Salary (USD) | Average Max Salary (USD) | Average Median Salary (USD) |
|---|---|---|---|
| US Onsite Jobs | $85,000 | $165,000 | $125,000 |
| Remote Jobs (US-based pay) | $80,000 | $160,000 | $120,000 |
| Remote Jobs (Global, adjusted) | $60,000 | $120,000 | $90,000 |
Salary FAQ:
❓ Are these salaries based on US jobs only?
The salary figures shown on this page are primarily based on United States job listings and remote positions offered by US-based companies. Some roles may include global remote opportunities where compensation aligns with US market standards.
❓ How often is the salary data updated?
Salary data on ForeignJobs.net is reviewed and updated annually to reflect current job market trends, employer listings, and compensation benchmarks for 2025–2026.
❓ Do these salaries represent base pay or total compensation?
The listed figures generally represent estimated annual base salaries. Total compensation may be higher depending on bonuses, equity, commissions, and additional benefits offered by employers.
❓ Why do salary ranges vary so much?
Salary ranges depend on several factors including experience level, company size, job location, industry demand, and specialized skills. Senior and high-demand roles typically command higher compensation.
❓ Are remote job salaries different from onsite salaries?
Remote salaries may vary depending on employer policy and geographic pay structures. Some companies offer location-based pay, while others provide standardized compensation for remote employees.
❓ Can I negotiate salary based on this data?
Yes. The salary ranges shown here can be used as a general benchmark when negotiating compensation. However, final offers depend on individual qualifications and employer budgets.
Looking for open positions? Browse the latest high-paying US Onsite and remote jobs at ForeignJobs
Salary Disclaimer:
The salary information provided on this page is for informational purposes only. Figures are estimated based on publicly available job postings, industry reports, and market research for 2025–2026. Actual compensation may vary depending on employer, location, experience level, and economic conditions.
Last updated: February 12, 2026 | Salary data for 2025–2026